© 2023, Rinchong Kim
Seoul, South Korea
All rights reserved.

Dacon is an online data science competition platform in Korea. Users join to participate in challenges sponsored or requested by Korean government or companies.

Task

Increase community engagement and user retention
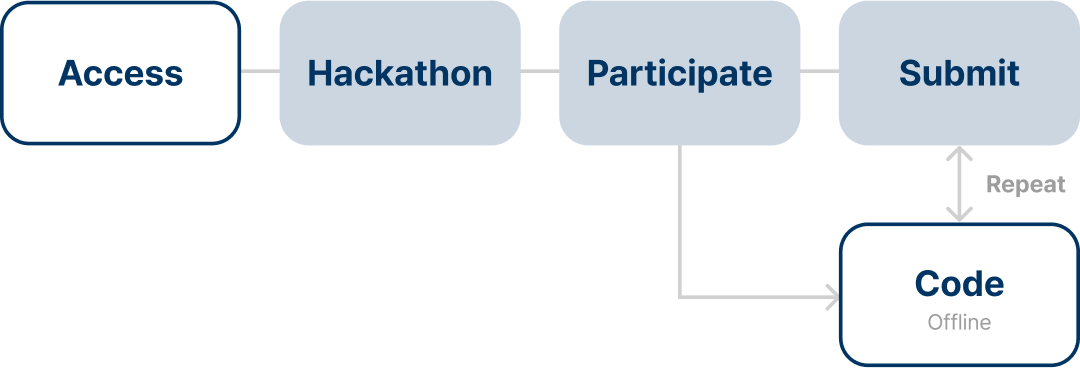
  • Strategy

    Think aloud, VoC

  • Design

    UX/UI

Open Project
Background

Scaling up

When I joined Dacon, the team was in the stage of scaling up; from a hackathon service, to an education platform.

To accomplish this, we needed to attract new users and enhance the retention rate of existing users. We conducted user research to clarify the problems and areas for improvement. With the findings from the user research, we then

Research

We took three steps in our research process; Defining user groups, asking our users and drawing insights.

Defining user groups

We defined the users into two groups using user behavior data from Google Analytics(GA).

Asking our users

Then we interviewed our users and conducted a think aloud protocol to find out more about their pain points.

Drawing insights

With research results and insights, we decided the areas to improve.

Research
>
Define

Navigation path
analysis

By analyzing user navigation patterns, I classified them into two categories: objective-driven and exploratory users.

0 %

Object-driven

Participate in hackathon

Users that were observed mostly navigating through hackathon pages

0 %

Exploratory

Explore various contents

Users participating in multiple hackathons and navigating through various contents

Research
>
Ask

Think Aloud Protocol

We brought users in to our office to observe what they try to do on our product, and what their pain points were while doing so.

I want to learn new ways to approach this problem. Where can I find the resources to do so?

Hmm, I visited the code share page, but there isn't any new contents.

I don't think the community is very engaging.

Research
>
Insights

Exploratory users ↑
Service revisit ↑

By analyzing user navigation patterns, I classified them into two categories: objective-driven and exploratory users.

New users

Users entered the service with a sole intention of participating a competition. They were considering participating in future competitions and using the platform more.

Revisiting users​

After participating in the competition, users wanted to revisit the service to explore contents within the platform. However, they felt discomfort due to the lack of posts and difficulty in accessing content.

Web

Improved main page

With findings from user research, the main screen was restructured to broaden the navigation path for users. Contents were redesigned with a dashboard layout, allowing access to competitions, education, and community contents.

Before (2020)
After (2021~)
1

Reduced emphasis
on hackathon

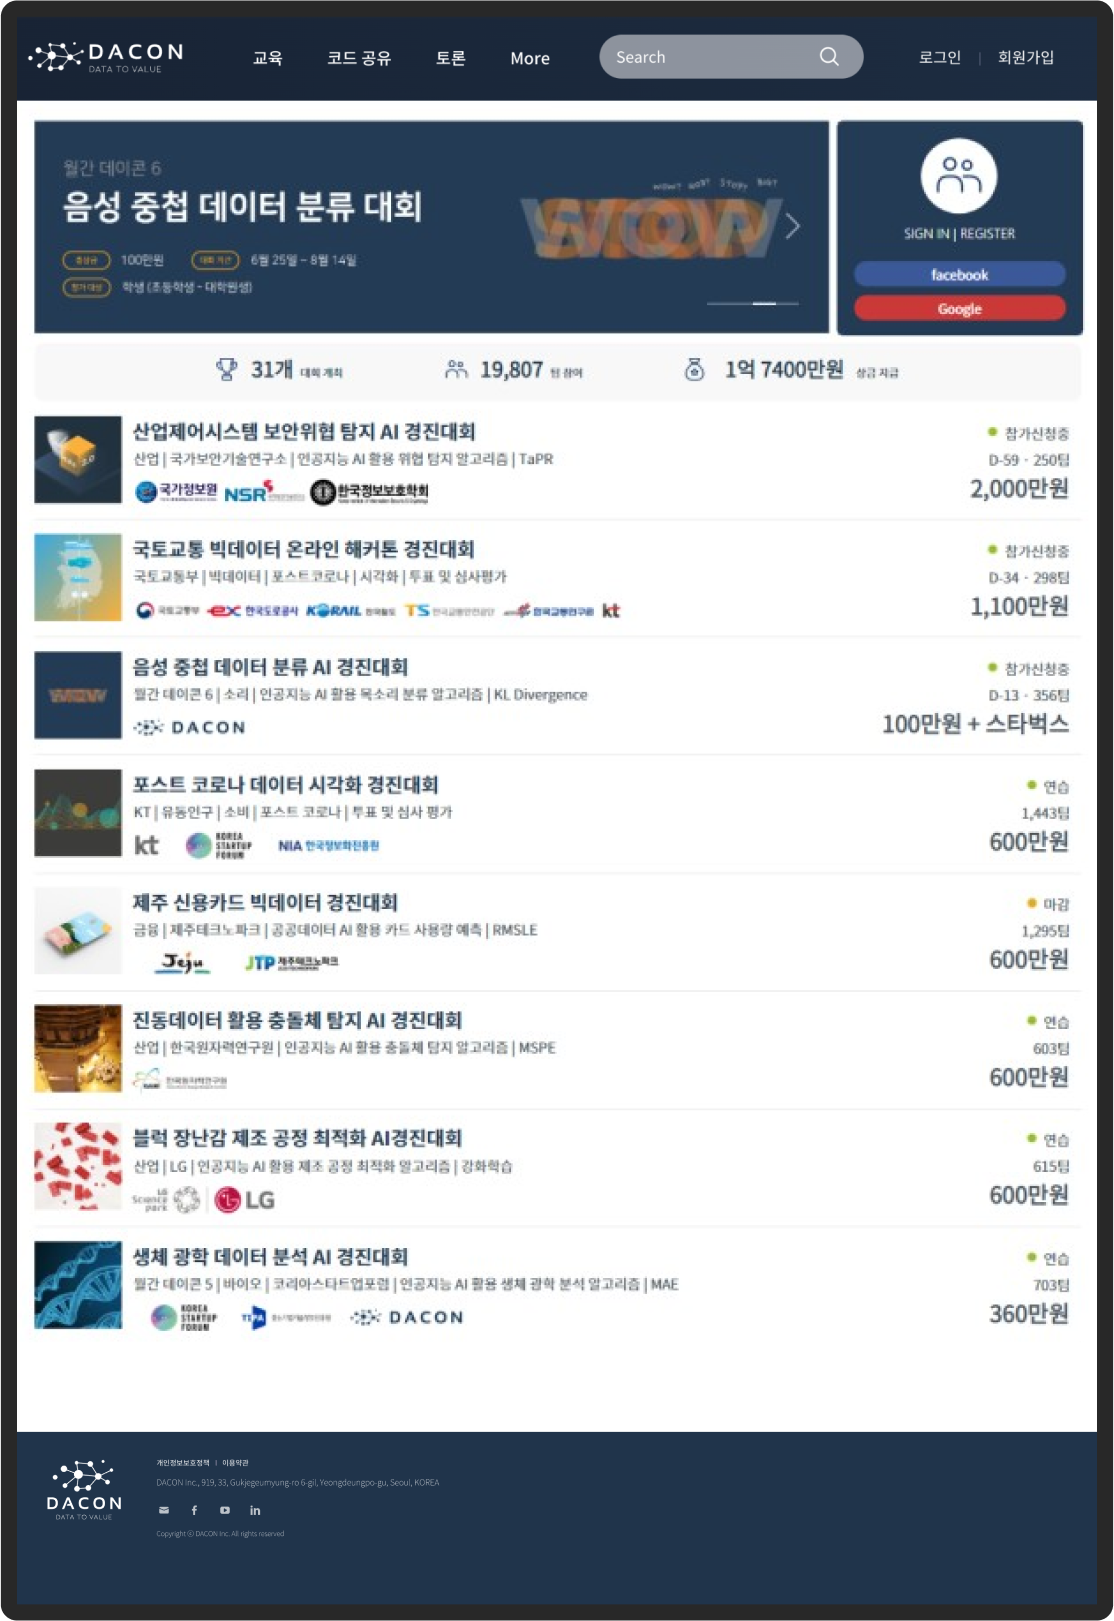
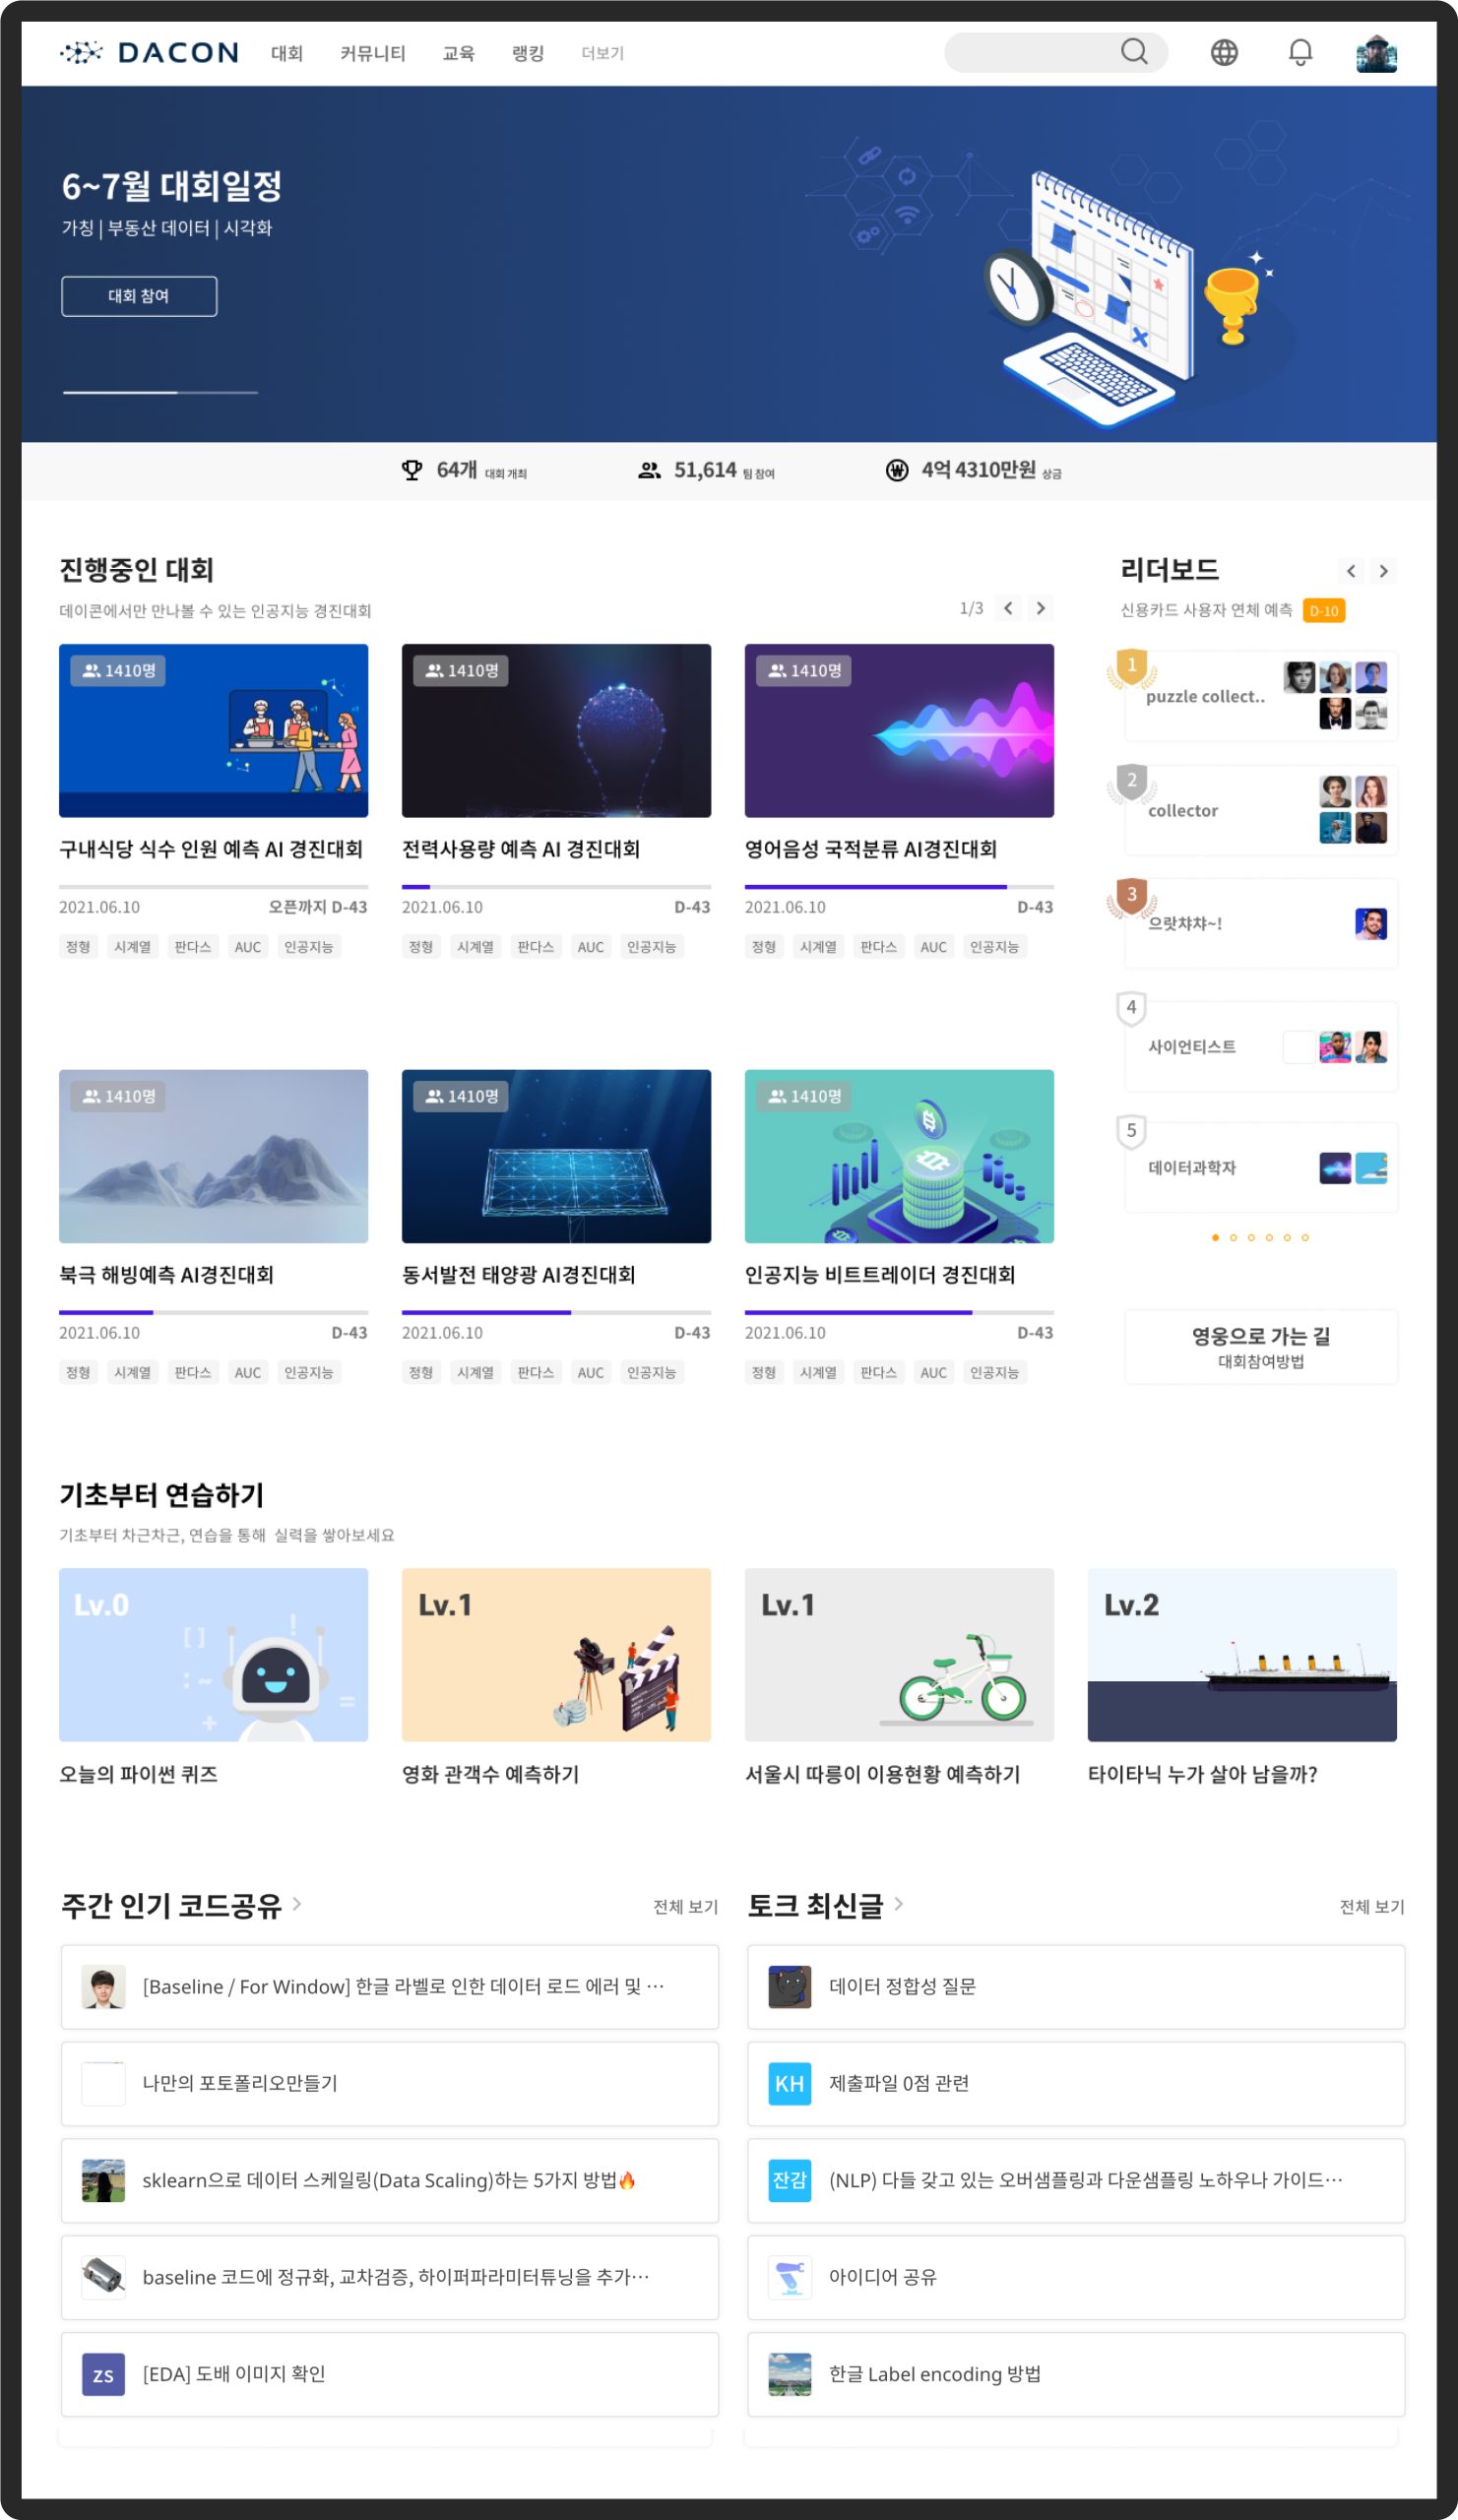
By shifting from list to card design for displaying hackathons, I minimized unnecessary whitespace and created more room for content. I also streamlined elements considering responsiveness.

2

Popular features added
to the main page

Realizing the frequent use of the leaderboard, I made the top 5 leaderboard results directly visible on the main page.
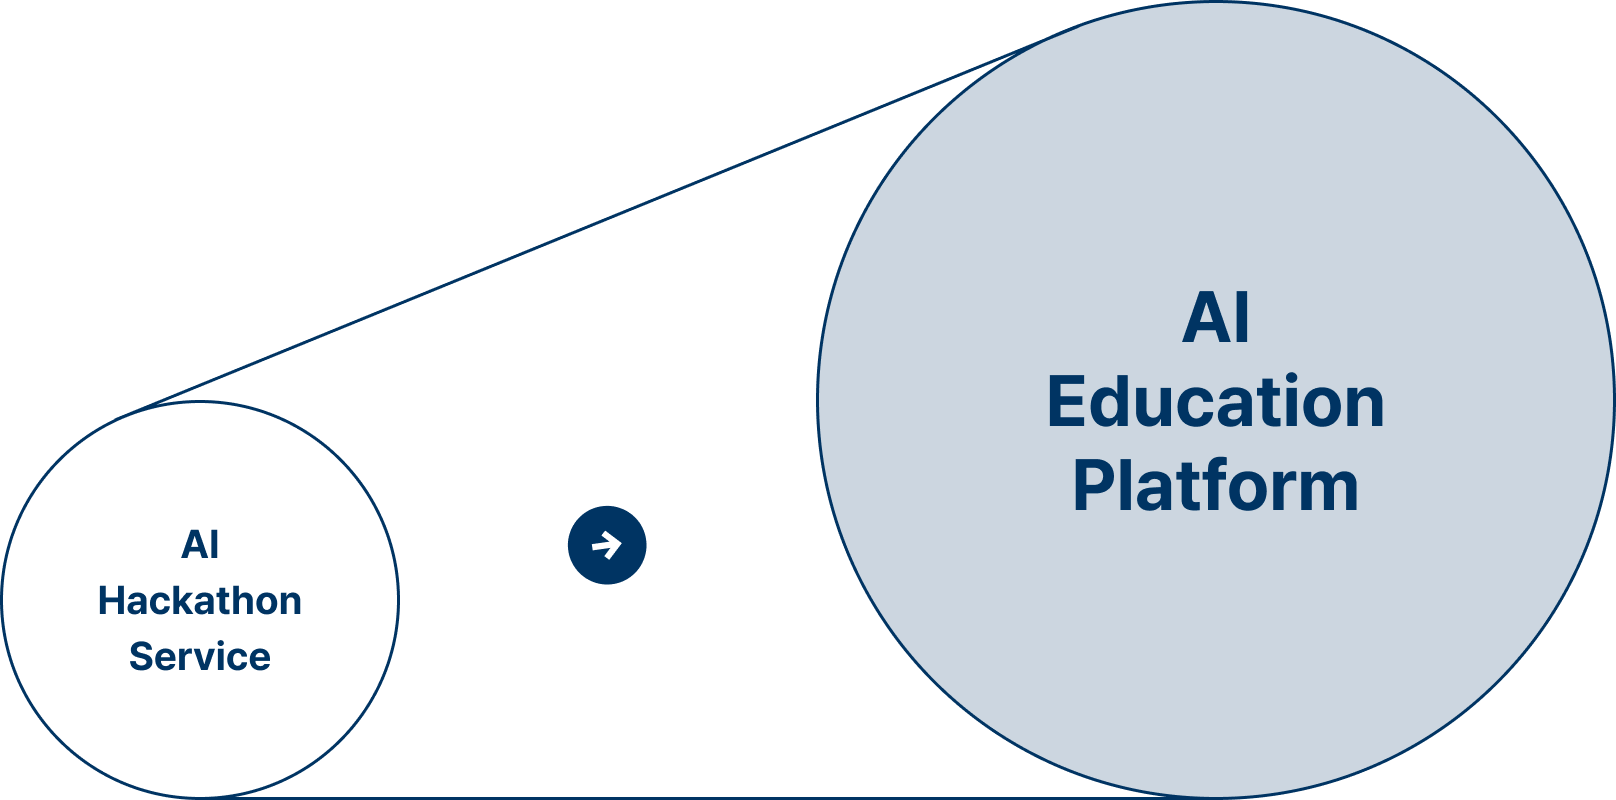
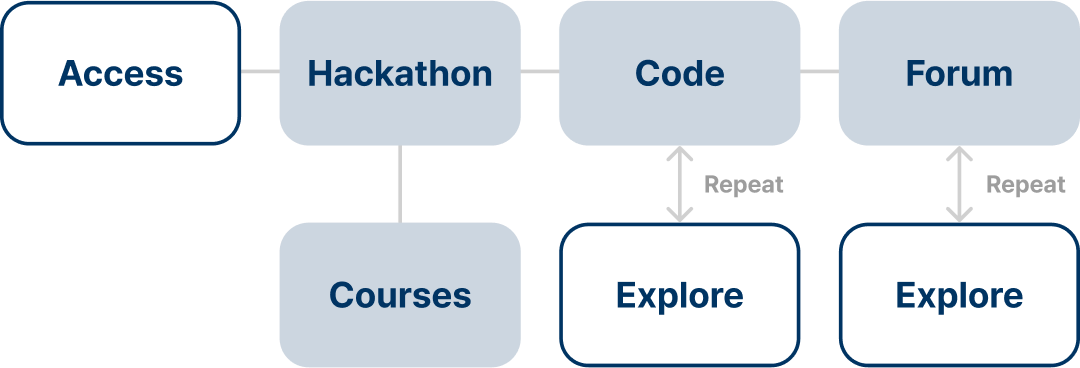
3

Educational content
easier to access

While hackathons are the main service, I placed educational content as a secondary priority to lower the entry barrier for new AI users and to expand business areas.

4

Improved content
accessibility

Since winning strategies and codes from hackathons were often shared in code-sharing and discussion forums, I highlighted popular posts from these boards on the main page.

Gamification

New ranking system

The existing ranking system, with its disconnected design from the platform, was providing an inconsistent user experience, and the tier titles were not well-established. Through surveys of users and employees, I designed a more intuitive tier system.

As a strategy to invigorate the community, rankings for code sharing and discussion were added. After implementation, an increase in users posting and participation was observed.

Before

After

Takeaways

The importance of data-driven decision making

Dacon was the first start-up that I took a role of a UX/UI designer. It was also the first project where I integrated both quantitative and qualitative data. I used Google Analytics to group users based on their behavior and employed the think-aloud protocol to understand users' objectives in the service. With successful outcomes of the redesign, I learned the significance of data-driven decision making in design.

Back